|
|
||
|
|
||
|
David Dunlap Observatory
(DDO) DDO Instrumentation |
|
|
|
|
||
|
|
||
|
|
|
|
Table of contents
The 1.88m telescope The telescope
has been the main instrument of the observatory. It is currently used
exclusively for spectroscopic research with two spectrographs, the Cassegrain and the Echelle.
<- The telescope is available for use to the staff, students and visitors
of the Department of Astronomy and to qualified researchers from
outside the Department (see the policies). ->
The telescope
has a considerable history (see RASC
Journal article or Department &
Observatory History) and has always been the focus of the astronomy
research at the David Dunlap Observatory. It is the first large
telescope with a Pyrex mirror (made by Corning Glass Works in 1933).
It was made by Grubb, Parsons and Co. in Newcastle-on-Tyne, England and
was dedicated on May 31, 1935. The mirror is one foot thick and
two tons. The telescope tube is 30 feet long and the moving parts of
the tube and the mount weigh 25 tons. The telescope
has been the main instrument of the observatory. It is currently used
exclusively for spectroscopic research with two spectrographs, the Cassegrain and the Echelle.
<- The telescope is available for use to the staff, students and visitors
of the Department of Astronomy and to qualified researchers from
outside the Department (see the policies). ->
The telescope
has a considerable history (see RASC
Journal article or Department &
Observatory History) and has always been the focus of the astronomy
research at the David Dunlap Observatory. It is the first large
telescope with a Pyrex mirror (made by Corning Glass Works in 1933).
It was made by Grubb, Parsons and Co. in Newcastle-on-Tyne, England and
was dedicated on May 31, 1935. The mirror is one foot thick and
two tons. The telescope tube is 30 feet long and the moving parts of
the tube and the mount weigh 25 tons.
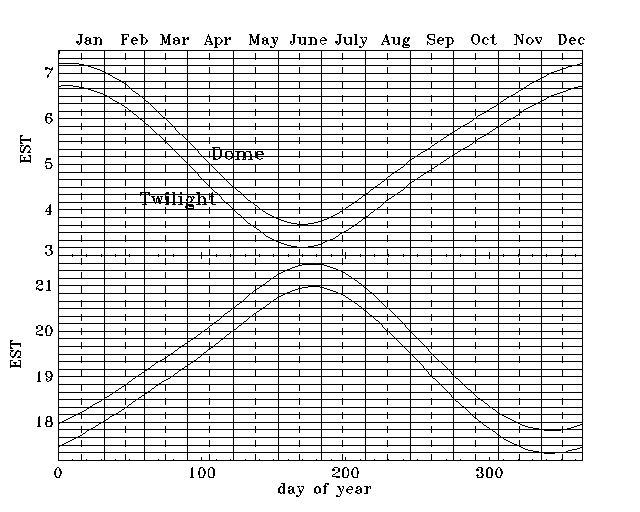
Currently, the 1.88m telescope is the largest astronomical telescope in Canada. Canadian astronomers have access to several university-owned telescopes in the range 0.6 to 1.8m. The next telescope in size in Canada is by 2 inches smaller 72" telescope of the Dominion Astrophysical Observatory, NRC in Victoria, B.C. Canadian astronomers have also direct access to two larger telescopes through 42.5% ownership of the Canada-France-Hawaii 3.6m telescope on Mauna Kea, Hawaii and the 15% share in two 8m Gemini telescopes on Mauna Kea and Cerro Pachon, Chile. As the statistics for five years, July 1999 - June 2004 indicates, the 1.88m telescope can be used for spectroscopic observations on 50-60% of scheduled nights, with an average duration of a night of 5.6-5.9 hours (yearly average). Geographical co-ordinatesThe coordinates of the 1.88m telescope were determined using traditional astronomical/geodetic methods some time ago: 5h17m41.3sW (79d25'20"W), 43d51'46"N, the height above the sea level 244m (the base of the dome, the telescope is some 6m higher). A new GPS determination of the coordinates (May 2000, Stefan Mochnacki) is as follows: 5h17m41.45sW (79d25'21.7"W), 43d51'46.7"N, the height above the sea level 239m (base of the dome). The GPS coordinates are good to about 0.001' (0.06"), or 1.85m, in all three directions. A new set of GPS measurements (Aug.2002, Waldek Ogloza
(Cracow)): Optical properties of the Cassegrain 1.88m telescopeThe telescope: The tube is about 900 cm (30 feet) long and its external diameter is about 210 cm (7 feet). The spectrographs attached at the Cassegrain focus and at the broken Cassegrain-mounted Echelle make the overall telescope size somewhat larger. Coordinate setting: The telescope can be set to about one arcmin using displays in the dome which are driven by a computer ("draco") in the warm room. The field of view of the guide camera in the acquisition mode is about 3 arcmin. Sometimes, the target object will not be visible from the warm room right after setting the telescope. For that reason, finder telescopes are occasionally used. Finder telescopes: The telescope has three refractive finder telescopes, two 4-inch on both sides (N & S) of the telescope and one 6-inch on the S-side. The 4-inch finders are used for visual observations while the 6-inch finder is now used with the SBIG ST-402ME CCD camera to simplify the field acquisition from the warm room. With 510x765 pixels at 1.2"/pix, the field of view on the computer screen is 15.4 x 10.3. Because of the flexure of the main telescope, there is some difference between pointing of the 6-inch and the 74-inch, but shifts in both coordinates are well mapped. Optical properties: An attempt has been made in 1999 to produce an optical model of the 1.88m telescope using ray tracing programs. No information was available on the main parameters of the telescope - except for the original factory drawings from the period 1932-1935. The model showed inconsistencies even with a totally unconstrained (and permitted to "float") secondary-mirror shape parameter 1-e2. Advice on that matter offered by several contacted persons increased the level of confusion and uncertainty. On August 27, 1999, Mrs. Kathy Kamper brought us diskettes of her late husband, Dr. Karl Kamper, who for many years was the Support Astronomer of the Observatory. Among the files, a BEAM-3/4 ray-tracing file from 1995 was located. It contained the telescope parameters exactly in the needed format. However, the source of these data is entirely unknown. In view of the uncertainties, both models are presented in the table below. The KK'95 model is probably the one to be used simply because of Karl's tremendous knowledge of the telescope.
Comments in the last column of the table: (1) The primary focal length in technical drawings has been given as exactly 30 feet which looks like a suspiciously round number; (2) The distance between the mirrors has been recovered in Rci'99 using the separation of the vertex of the secondary from the focus of the primary, given as 7'3/4"; it is not known why it is different in the KK'95 solution; (3) The radius of curvature of the secondary is given as 231.6" in the technical drawings which corresponds to 588.26 cm; it is different in the KK'95 solution for unknown reasons, but appears to be wrong for the Rci'99 solution as well - the radius of curvature must be longer than 588 cm for overall consistency; (4) The shape parameter in Rci'99 was obtained by iterating the optical solution for best convergence with fixed known dimensions; (5) The location of the Cassegrain focus below the vertex of the primary mirror is given in technical drawings as 3'1". Spatial and temporal limitations
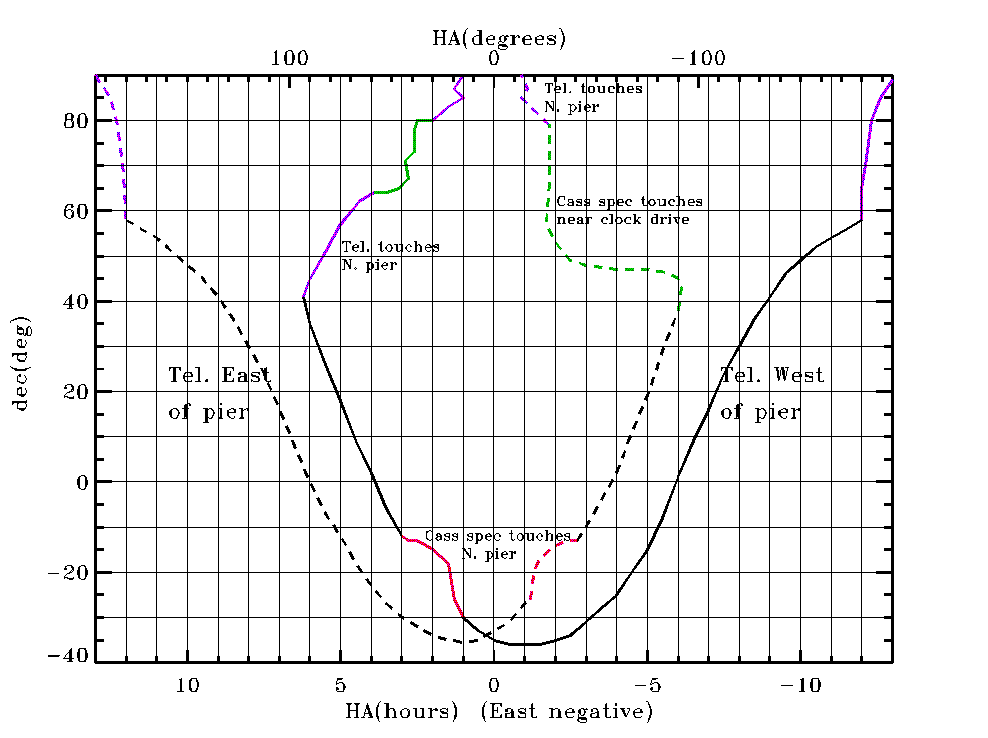
The telescope currently points to about one arc-min. We try to improve the telescope pointing by using lookup error maps. 1.88m telescope spectrographsCurrently, the observatory uses two spectrographs on the 1.88 m telescope, the Cassegrain (Cass) and Echelle (Ech) spectrographs. We have two CCD detectors, a rectangular 2048 x 512 pixel thinned chip and a square 1024 pixel thick chip.. CCD detectorsThe general situationWe have utilized a number of liquid-nitrogen cooled systems CCD chips. Here is their general description.
The JY systems required modification of the CCD mounting and support and are heavier than the THX-based systems. As a result, we experience some spectrograph flexure effects which may be not fully eliminated by the comparison lamp spectra. The differential shifts are at a level of up to ½ pixel which may result in about 4 km/s systematic radial velocity deviations for the highest resolution (1800 l/mm) Cassegrain spectrograph setup. The actual spread in radial velocities is however smaller than ±2 km/s and typically stays within ±1 km/s. JY#2
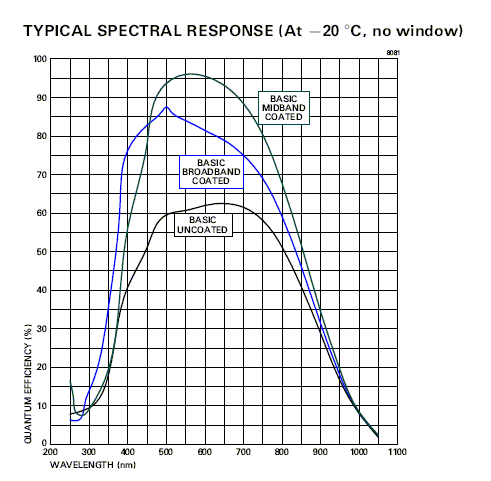
Above is the nominal quantum
efficiency curve of the Jobin-Yvon
(J-Y), thinned, back-illuminated
detector JY#2 used in the Cass spectrograph since October 2004. The
detector
should be most sensitive at about 650 nm where its QE reaches about
62%; see the curve "Uncoated". The chip is not as good as one could
expect, yet it is
more sensitive that the THX chips. The readout noise is about 15
electrons (large!) at the gain setting #1 (~2el/ADU); the nominal gains
(to be
checked) are: 2, 6, 12, 24 el/ADU for the gain settings #1, 2, 3, 4,
respectively. The maximum well capacity is nominally
130,000 els (65,000 ADU). The pixel size
is 13.5x13.5 micron. The FITS format limitation on the integer
number size is
64K (65,500 levels).
JY#1 (no longer in use)
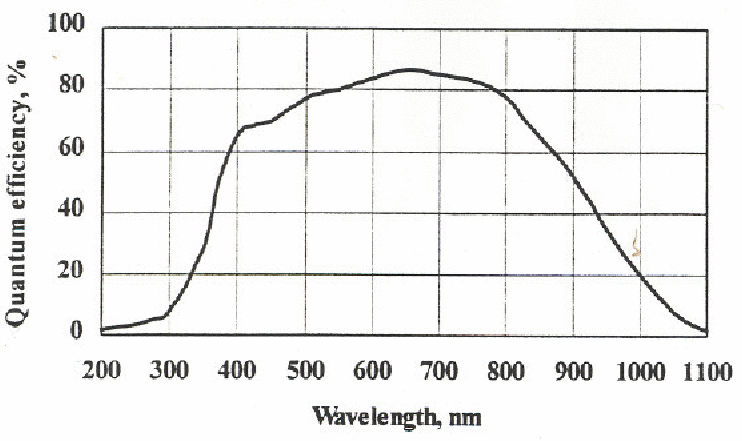
The nominal quantum efficiency
curve of the Jobin-Yvon
(J-Y), thinned, back-illuminated detector is shown above. The detector
should be most sensitive at about 650 nm where its QE reaches about
85%; its sensitivity is expected to be very good in other parts of the
spectrum - even at 400 nm should reach 65%. The readout noise is about
7 electrons with the gain 2 el/ADU. The maximum well capacity is
nominally 60,000 els (30,000 ADU). The
pixel size is 15x15 micron. The J-Y system was sent back to
manufacturers in April 2004 where it failed during the repair.
Thomson/Photometric chips (THX#1, #2?, #3)
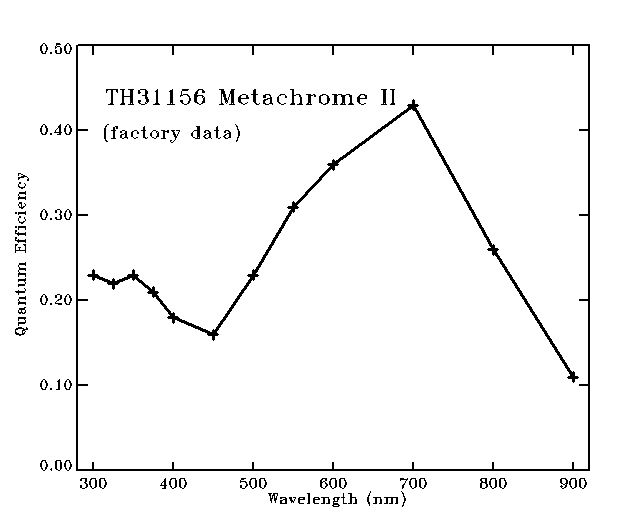
The THX chips are square, 1024x1024 pixels, with the square pixel size of 19 microns. They have excellent cosmetic properties with very few hot pixels. For the Cassegrain spectrograph, 200 lines are usually used, sometimes with 4-times binning in y-direction, giving images 1024x50 in size. Cassegrain spectrographClick here to see several photographs of the Cassegrain spectrograph. SlitsThe focal scale of the 1.88m telescope is 6 arcsec/mm. The slits are not regulated with three fixed widths currently in use: 200, 250 and 300 microns (1.2, 1.5 and 1.8 arcsec on the sky). The slit height is 10 mm or 60" on the sky. The projected scale (“minification” of the collimator – camera combination) is about 4 times, i.e. the 300 micron slit (1.8 arcsec on the sky) produces an image 75 micron wide. The orientation on the sky is fixed, E-W, and the spectrograph cannot be rotated. Diffraction gratingsSeveral gratings are in use. They are designated by the number
of lines per mm and a letter code. The table gives the parameters as
well as an estimate of the condition of the grating, by Karl Kamper, in 1993 (the last column), modified
later as need be. The data below are for 1024 pixel, 19 micron pixel-size
Thomson CCD chip. The J-Y CCD has smaller pixels (13.5 micron) and is
2x longer, 2048 pix. Thus, the data below
require re-scaling by the ratio of the pixel sizes. The J-Y pixels are
0.71 times smaller in length than for the TH chip, while the spectral
window is
1.42 times longer. Eg., for the "2160K" grating, the scale is 0.124
A/pix and the window length is 255A. The order-separation filter codes are as follows: S = short
wave cutoff, B = bandpass
filter (see the list of the currently available
filters). Note that the highest dispersion “2160K” grating cannot
be used at >6500A and has poor efficiency beyond 5500A.
Limiting magnitudesThis discussion is for the Thomson/Photometrics CCD chips. The J-Y is expected - nominally - to be about 2x more sensitive in the yellow-red and some 3-5x more sensitive in the blue. It is rather difficult to give accurate numbers for the limiting magnitudes as the overall efficiency may vary by a very large factor since it strongly depends on the seeing conditions and on the S/N required. The seeing disk is typically (median) 1.7 arcsec. There are indications that the seeing is improving with time as the amount of heat generated by the Toronto megacity increases. In the Spring of 1999, the seeing was frequently observed to be at the level of 1.0-1.2 arcsec while in the Spring of 2000/2001, it was as bad as 5-7 arcsec... Well exposed (S/N about 30) spectra can be easily obtained to 10 - 11 mag for the highest dispersions and 13 - 15 mag for the lowest dispersions, as per the table above. These numbers are given here only for your guidance and are frequently subject to agitated disputes. In the strict sense, the current limiting magnitude (i.e. low S/N, emission-line objects) at any dispersion is about 15-16 mag for a half-hour exposure and is defined - paradoxically - not by the spectrograph capabilities, but by the bright sky and our ability to see and guide on the star with the intensified TV guide camera. The half-hour requirement results from our attempts to control the spectrograph flexure. In fact, longer exposures suffer also from numerous cosmic ray hits, so we seldom expose for longer than 20 - 30 minutes. Objects as faint as 15-16 mag have been successfully observed with the current instrumentation. The sky brightness was measured on two nights in February 2001 using direct images obtained with an ST-6 CCD mounted on the 6-inch finder. On the darker of the two winter nights, the brightness was found to be R=16.8 mag per square arcsec. These were unfiltered observations, so the matter of the band-pass match is debatable; the standard stars sequences could not be fit to V- or I-band magnitudes, but the R-band gave a reasonable fit. It should be noted that the sky over Toronto is relatively dark in some spectral regions. 17 mag per square arcsec may be a good number to assume. Focusing of the spectrographThe Cassegrain spectrograph is focused with the Hartmann mask, set in two positions, traditionally called "inboard" and "outboard". Two cuts through the respective spectra are taken and overplotted. A 1 pixel (THX) shift of the outboard to right (blue), requires about a +0.13 focus unit correction. Ideally the outboard plot should be shifted slightly to red if one expects temperature to drop through the night. For the JY chips, the blue end of the spectrum is to the left and the scale is smaller because of the smaller pixels (13.5 and 15um versus 19um), so that the focus adjustment per 1 pixel shift was about +0.08-0.10. A detailed description of the spectrograph setup is accessible through the internal DDO Web page. Radial velocity accuracy & spectrograph flexureWith the Cassegrain spectrograph, one can hope to achieve
accuracy of radial velocities at a level of 1 km/s or slightly better.
Results for late-type, sharp-line stars, based on the THX#1 system are
described in the Technical Report
#10 by Evans et al. Radial velocities obtained in the short-period binaries program
indicate similar accuracy for standard and template stars. The absolute
mechanical spectrograph flexure has been measured using the comparison
spectrum in 1994 and in 2000 (results).
The amount of flexure as the function of HA has not changed since 1994
and is about ±1.5 pix (1 pix = 19 microns) along the dispersion and about
±0.5 pix perpendicular to the
dispersion. Note that the spectrograph has an active system of
counterweights to keep its optical plate undistorted, so the flexure
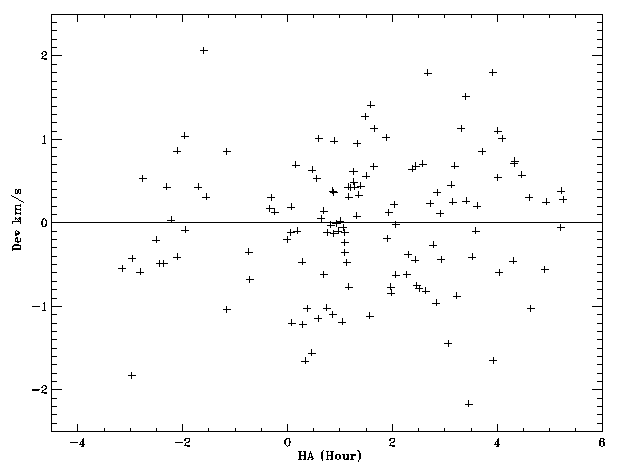
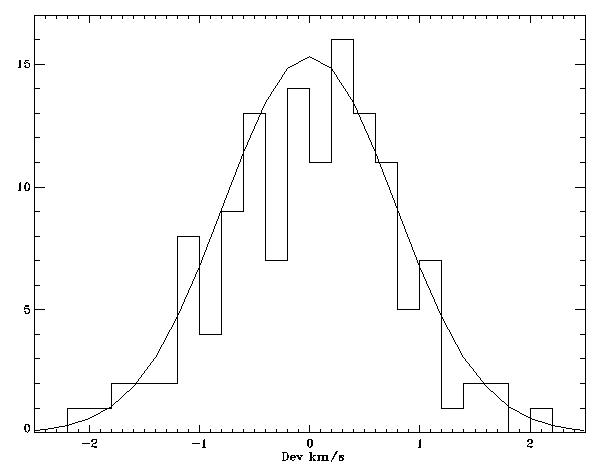
effects may change in time. With the new, heavier JY systems, we experience larger flexure effects, and in particular the differential flexure (star relative to comparison) which is most probably caused by comparison lamp assembly not being attached to the spectrograph, but to the telescope, so that the stellar and lamp beams do not enter the slit in the same way at different telescope elevations. In 2005, Michal Siwak (Cracow, Poland), analyzed RV deviations of standards in relation to other standards utilizing the telluric lines around 6290A. The results are shown below as a function of the hour angle (the telescope West of the pier) and as a histogram compared with the Gaussian fit with sigma = 0.78 km/s. As these figures show, systematic HA effects appear to be largely absent, while the random errors (for sharp-lined standards!) are within ±2 km/s with sigma = 0.78 km/s.
Echelle spectrographClick here to see several photographs of the Echelle spectrograph. There is no change of scale ("minification") in this spectrograph so that the image of the slit has the same width as the slit. The slit is fully adjustable. The scale on the sky is 10 arcsec/mm due to a built-in focal reducer. There are three cross-dispersing gratings available: 300, 600,
1200
lines/mm blazed for 7600A, 5000A and 4000A, respectively. To estimate
the resolution of the spectrograph (which is
determined by the echelle grating alone),
use the following formulae: Since the projected slit width equals to the slit width, the
resolution is: A relation between the slit width on the sky and the physical slit width is: sky(arcsec) = slit(microns)/100; i.e. for 1.5 arcsec on the sky, use 150 for the width in microns. Note that the median seeing at the DDO is 1.8 arcsec, but the range is a large one, from 1.0 to 5 arcsec. The limiting magnitudes are even harder to estimate than for the Cass spectrograph because they are more sensitive to the seeing conditions (the slit is typically narrower). They are at the level of about 5-7 mag. Wavelength calibrationsSimilar to most Cassegrain-focus mounted spectrographs, our instruments are subject to some degree of flexure, often with hysteresis, so that wavelength versus position calibrations must be done for each object. The recommended maximum exposure times and thus spacing between wavelength calibration exposures are one hour for the Cass spectrograph and one-half to one hour for the Ech spectrograph (in practice, we seldom expose for more than 1/2 hour, also because of the cosmic rays). Comparison exposures, to be taken before and after the object exposures, should show at least 6 well exposed and spaced lines to model the 3-term dispersion curve. As an exposure guide, line peaks should be at least 100 ADU. We use 4 lamps: Fe-Ar, Fe-Ne, Th-Ar and Ti-Ne. The comparison lamp unit has an eight-position wheel with neutral density filters within the range of 0.3 to 3 (attenuation by factor of 2 to 1000 times). Bias and DarkThe bias of our CCD at base gain (cgain=0 in the Photometrics' control program) is nearly flat, but a deepening depression in the lower numbered columns occurs at ever higher gains, requiring correction by bias frame subtraction. These can be done before or after observing and a large number (say 25) of exposures are recommended. We usually bin the CCD in the direction perpendicular to the dispersion. For the Cass spectrograph, this means that 200 lines are mapped into 50 lines, so that the final images have 50x1024 pixels; for the Ech spectrograph the same y-binning results in images 256x1024 in size. The readout time is then about 10 seconds. For a rough recommendation, store five means of four exposures each. The mean bias level with the CCD drifts with the temperature of the camera controller, which is connected by a short cable to the dewar. The temperature variations may be large at DDO (this is not a high-altitude observatory above a temperature inversion!) so that this variation must be monitored by taking bias exposures through the night. Flat fieldsQuartz halide lamps with filament images projected in suitable soft focus on the entrance apertures are available for our spectrographs with beam f/ratios that match the incoming starlight. Exposure times for the CCD are less than a minute for all common setups, so that the multiple exposures necessary to minimise the noise in the flat field calibration can be readily made. The Thomson chip is sufficiently uniform that, at S/N ratios much below 200, flat fielding is only necessary to correct grating response or other instrumental non-uniformities. For simple spectra with well defined continua, you might chose not to do the flat field division. We strongly recommend taking the flats anyhow, and they are mandatory for the highest S/N situations. An absolute minimum is four tungsten exposures with mean ADU equal to the strongest stellar exposure. Ten exposures is a commonly used set. It is possible, because the linearity of the system response is good, to use tungsten exposures which are systematically stronger than the stellar exposures, but we do not recommend exceeding 75% of full well. The warm room environmentTwo Windows in the warm-room of the dome are used for the CCD
control and telescope positioning, they are: "taurus"
and "draco" for the J-Y CCD system and "cepheus" and "draco"
for the Photometrics CCD. The computers
work in tandem in the sense that FITS headers contain data from both
computers. The UT time is available on-line from the Web resources and
also written into the headers, together with many auxiliary data about
the instrumentation. Morning backups are made to the computers in the
DDO administration building ("aquila",
"hydra") and then written permanently to CD and DAT media. In
addition, a Linux computer, "umi", can be
used by observers for Web access, e-mail, retreival
of finding charts, work in IRAF, etc. "umi" contains the full backup of
all CCD data for direct retreival. The coordinate input to "draco" is through a simple interface which accepts input from the keyboard with the reference epoch normally assumed to be J2000 (other epochs can be entered too and are then precessed). The coordinate program uses the HIP and Tycho-2 catalogue data (which include proper motions), with searches based on HIP, HD and GSC/TYC2 numbers; basically all stars brighter than about 11 mag can be rapidly and accurately found. The telescope cannot be moved blindly from the warm room because of the danger of collisions with the internal dome structures such as the Newtonian bridge or the maintenance platform on the top of the dome. The telescope is pointed by leaving the warm room and going into the dome where the telescope is moved to a position given by a differential co-ordinate display there (controlled by "draco"). Following this move, which sets the telescope to about one arcmin, the image of the field can be inspected in the warm room on the screen of the intensified CCD-TV guide camera for a more accurate pointing. The FOV in the acquisition mode is 1x1 arcmin, while in the slit mode about 0.5x0.5 arcmin. Random and semi-random errors of the coordinate encoders (coming from gears leading to the encoders) produce jitter of about one arcmin, so that the object will not always be visible in the one arcmin field of the camera. For that reason, a CCD camera (SBig ST-402ME) has been installed on the 6-inch finder telescope to see the brightest stars in the field of about 15x10 arcmin. Thus, finding charts of about 10 arcmin per side are very useful. The two 4-inch finders are occasionally used for direct visual inspection of the field. Slavek Rucinski |
||||||||||||||||||||||||||||||||||||||||||||||||||||||||||||||||||||||||||||||||||||||||||||||||||||||||||||||||||||||||||||||||||||||||||||||||||||||||||||||||||||||||||||||||||||||||
|
|
||||||||||||||||||||||||||||||||||||||||||||||||||||||||||||||||||||||||||||||||||||||||||||||||||||||||||||||||||||||||||||||||||||||||||||||||||||||||||||||||||||||||||||||||||||||||
|
Page maintained by: rucinski@astro.utoronto.ca
|
