Welcome, CASCA 2019!
If you're here, then you probably want to learn more about my poster. You can find out more below. If you're interested in some of my other work, please click here to see work done by the Canadian team for LiteBIRD, an upcoming CMB satellite mission led by JAXA.
Probabilistic Modelling of Gaia DR2 Systematics
Here's the poster that you saw. This work was done under the supervision of Prof. Jo Bovy at the University of Toronto.
Click below to download a PDF copy.
Download
Probabilistic Model
Our probabilistic model is inspired by (Sesar et al, 2017), and it relates the apparent magnitude (m) of red clump stars to the observed Gaia parallax (ϖ) through the distance modulus (µ), or the distance to the star (r)
 .
.
The true parallax (ϖ') measured by Gaia is offset by the zero point parallax (ϖ0) as follows
 .
.
The likelihood of observed parallaxes are modeled around the true parallax through a normal distribution
 ,
,
and the parallax error (σϖ) is modeled on the reported parallax error (ςϖ) with scaling and offset parameters
 .
.
We then model the absolute magnitude (M) of red clump stars with dependence on the color (J0-K0), calculated with 2MASS J and K band magnitudes, and the metallicity ([Fe/H])
 ,
,
where we define Mref as the typical absolute magnitude of a red clump star at the median values of the colour/metallicity ranges of our sample. The likelihood of red clump distance moduli are then modeled as a Student's t-distribution
 ,
,
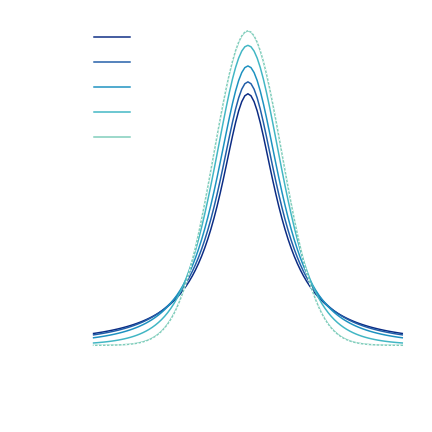
where the error in the modeled absolute magnitude (σM) is assumed to be the dominant source of error. A Student's t-distribution is similar to a Gaussian distribution, but with an added degrees-of-freedom parameter (ν) which elevates the tails of the distribution. For large values of ν, the Student's t-distribution converges to a Gaussian. Examples of Student t's are shown below.

We implement and sample our models in the Python implementation of Stan.
Further extensions to our model include adding dependences on observed magnitude/colour and sky position to the zero point parallax. We are also able to combine multiple photometric observations with a multivariate Student's t-distribution with a full covariance matrix. Look forward to reading more about this in our submission later this summer.Gaia Zero-Point Parallax
Below is an example of posterior distributions for model parameters in a joint 2MASS Ks-band and Gaia G-band photometry. Please don't hesitate to contact me to learn more!

The Canadian LiteBIRD Team
Below is a poster created by Simran Nerval showcasing her work on CMB readout systematics for the upcoming LiteBIRD satellite. Please take the time to find her at her poster and talk about LiteBIRD!
